
Mai 20, 2019 •Redaktion
Whenever I start a new project with a client, one of my first questions is: what data have you got, that we can draw a baseline on?
Most of the time the answer I receive is: all the data!
I’ve learned not to get too excited about that over the years, because as it turns out, it’s usually quantity over quality in those cases. Be honest, have you used the data you collected over the last 6 months to improve your marketing strategy? It’s no shame if you’ve answered with a firm ‘no’, but you should change that. Data really is the gold of the 21st century and you should use the data you collect.
In this article I’ll give you insight into how to draw the most important infos from the mountain of data you’ve collected. If you’ve not started collecting data for your business yet, this article is also for you, because you’ll know what to watch out for. PS: The next article in my pipeline is about setting up your data collection in the right way, so keep an eye out for that.
Before we get to the good part, let me just say that this article will be focused solely on Google Analytics. But don’t worry, many things are very similar in Matomo or other data collection tools.
Now let’s dive in:
Seriously, content groups are the shit! They let you divide your data into logical sections according to your website structure. The default setting in Analytics shows you all data for all URLs that have been visited at least once in your chosen time frame. That’s cool, but also the data is ripped out of context. Let’s assume you’ve got got the sections ‘products’ and ‘services’ on your website. Users will most likely use these sections differently, but Analytics will show you that data in comparison, because it doesn’t know that these are two different sections and you might be left comparing apples to pears. Another benefit of content groups is that it’s an easy way of viewing your data based on your page topics or categories without having to look through the whole mass of data.
The easiest way to set up one or more content groups, is via the Analytics interface. To set up the most basic content grouping there’s only three steps.
1. Open your Analytics Account and go to Settings
2. In the right hand column choose ‘Content Grouping’ and select ‘New Content Grouping’
3. Decide which set-up you can use. This can be a bit tricky.
The easiest way is to set up your group using ‘rule definitions’, however, your site has to be structured in a certain way to use this option. This is the way for you, if your URL structure is clear, for example yourdomain.com/Products/*. But if your URLs are full of parameters and other stuff you won’t be able to use this method.
You can also group by ‘extraction’, usually based on the page title. This is very similar to the set-up via ‘rule definition’. To be able to use this option, your page titles have to be defined and tagged.
The last option of setting up a content grouping is via the tracking code. As it says on the tin, this option allows you to set up a content grouping by making changes to the analytics tracking code. In order to do this you’ll need some experiencing in programming, or a developer to do it for you. I’m not going to get into how to do this in this article, because that would blow out my word limit, but there are some very detailed articles out there to explain this in detail; for example this one.
Let’s pretend we were able to use the easiest way, namely the rule definition by URL. Here’s what that would look like for our fictional ‘products and services’ categories:
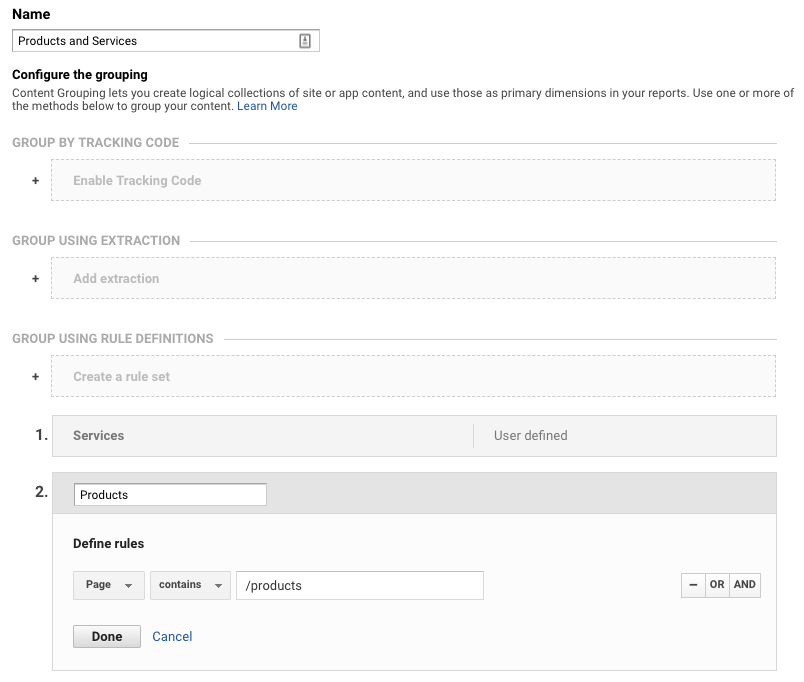
Of course you can use this in a more detailed way as well, for example if you’ve got specific product pages that can be grouped together, or categories of your blog etc. there’s really no limit.
You now have the option to see data according the content groupings in the ‘behavior’ section of Analytics. BUT keep in mind that groupings are applied as new data is collected, which means that the data you’ve already collected will not show up in the groupings you’ve just created. Ideally if you have the time and knowledge, you would now continue to set up advanced segments for these groupings, to help you get an even more detailed insight. But as a first step, setting up general groupings is the way to go.
Conversions are a great way to see how your Website goals perform. Essentially a conversion is a completed activity, online or offline, that’s important for your business. This could be the purchase of a product in an online shop, the registration for a newsletter, or the submission of an online contact form. Regardless of what it is you count as a conversion for your business, you should always have an overview of how many conversions have taken place and how they came to be. Google Analytics has a whole section dedicated to this and you should be using it.
There’s two ways to set up conversions in the Analytics interface. Either way you’ll want to start by:
1. Going to the settings and choosing ‘goals’
2. Choose a template (if applicable) or use the ‘custom’ option. Let’s assume we chose the template titled ‘revenue’
3. Now you have to choose the goal description, which basically decides when a conversion is triggered. If you’ve got a specific URL, that shows up only after the chosen conversion has been completed, you should choose ‘destination’, in the case of a registration for a newsletter this might be ‘thanks.html’. If you’ve already got an event set up in the Tag Manager, you can also import it into the Analytics conversion in the next step.
4. In this step you enter the goal details. This will look different according to the description, you’ve chosen in the previous step. They are all pretty straight forward, but let’s have a closer look at the details anyways. If you’ve chosen ‘Event’ in the previous step, what you’ll see is this:
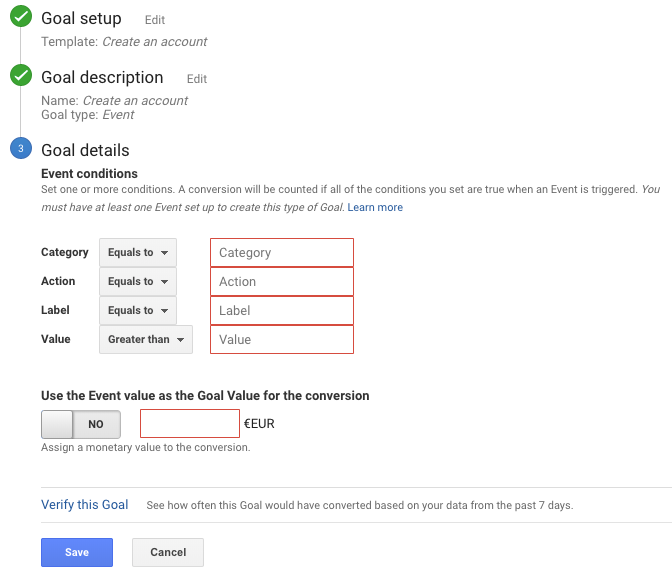
You’ll want to now switch over to the Tag Manager to check the category etc. for the respective event and copy it over to Analytics. You don’t have to fill in all the fields, but do make sure that the field you choose is unique in the Tag Manager (category usually is the way to go here).
If you’ve gone by destination, your screen should look like this:
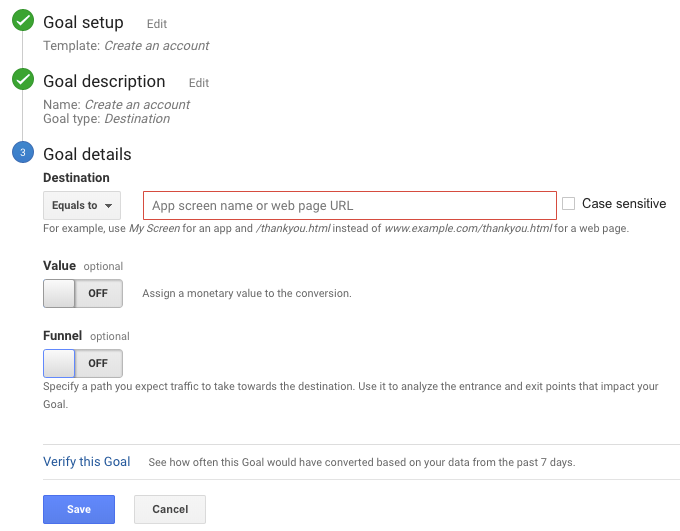
The destination you’ll enter will be the path of the URL that is unique, for example /thanks.html.
You also have the options to assign a monetary value to the conversion. Really, I think this only makes sense if it’s a purchase and then you should use the Ecommerce tracking. However, if you have data that supports that, maybe on average a newsletter sign up brings you $10 revenue, feel free to add this in.
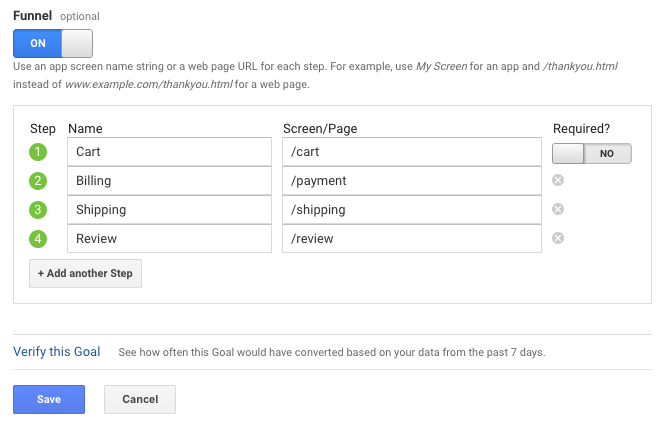
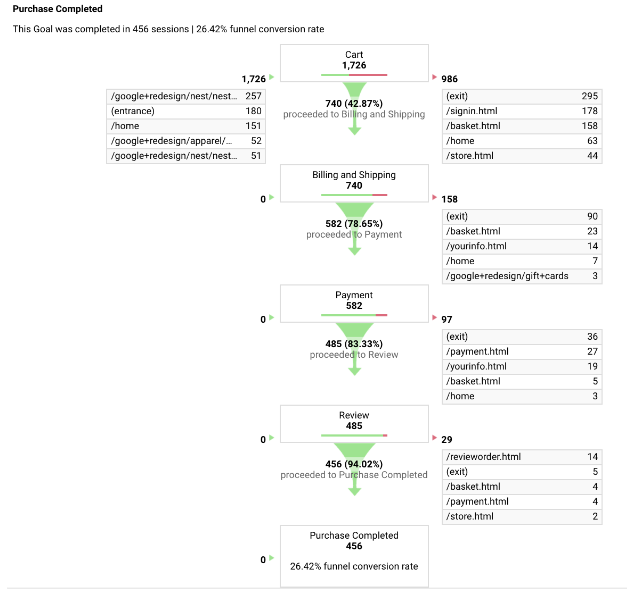
Another option you have is to create a funnel. Now I strongly suggest you do this, especially if you’ve set up a conversion for a purchase. Essentially, what the funnel visualization allows you to do, is see at a glance how your users behaved i.e. where they dropped off along the way. In checkout processes this is essential knowledge to have, because you might think having 100 purchases a day is great, but if you’ve had 1000 users adding products to their carts and then dropping off somewhere along the way, this number might actually disappoint and give you an idea on where you could improve the process. Setting up a funnel is straightforward, but you’ll have to have a clear URL structure. This is what it could look like for a checkout process:
In the end, once you’ve started collecting data, this would display along the lines of this:
Now that the conversion is set up, you’ll be able to track it in Analytics. But Analytics offers even more. You’ll be able to see the reverse goal path, which will help you understand how users interacted with your site before the conversion. You’ll also be able to use the Multi-Channel-Funnel, which gives you an insight into what channel mix led users to your site and eventually moved them to convert. I’ll be writing another article on the MCF, so be on the lookout of that.
I hope this article gave you an idea about how to quickly set up some important Analytics features that help you better understand your users and customers. If there are any open questions, don’t hesitate to get in touch with me, I love chatting about all things Online Marketing!